Student Loan Debt Statistics
Here are the key student loan debt statistics to know, including how much student loan debt exists, how much individual borrowers owe, how much loan forgiveness has been processed. the types of student loans borrowers have and how they're repaying them.
We strive to keep this information updated regularly based on the latest data from the Federal Reserve, private surveys and research, and more.
This data is accurate as of June 2024.
Key Student Loan Statistics
Here are the key student loan debt statistics as of the end of 2023:
- Total Student Loan Debt: $1.76 Trillion
- Number Of Student Loan Borrowers: 43.2 Million Borrowers
- Total Federal Student Loan Debt: $1.60 Trillion
- Total Private Student Loan Debt: $130 Billion
- Average Federal Student Loan Debt Per Borrower: $37,088
- Median Federal Student Loan Debt Per Borrower: $19,281
Other key facts:
- 20% of American adults with an undergraduate degree have student loan debt
- Each year, roughly 32% of American undergraduate students accept new student debt
- Approximately $100 Billion in new student loans are issued every year
- 7% of student loans are in default at any given time
- Total Student Loan Debt: $1.76 Trillion
- Number Of Student Loan Borrowers: 43.2 Million Borrowers
- Total Federal Student Loan Debt: $1.60 Trillion
- Total Private Student Loan Debt: $130 Billion
Roughly $100 Billion in new student loans is issued each year. However, the total amount of student loan debt is on the decline for the first time ever.
Total Student Loan Debt By Year | |
|---|---|
Year | Total Debt |
2023 | $1.73 Trillion |
2022 | $1.76 Trillion |
2021 | $1.73 Trillion |
2020 | $1.69 Trillion |
2019 | $1.64 Trillion |
2018 | $1.57 Trillion |
2017 | $1.49 Trillion |
2016 | $1.41 Trillion |
2015 | $1.32 Trillion |
2014 | $1.24 Trillion |
2013 | $1.15 Trillion |
2012 | $1.05 Trillion |
2011 | $0.96 Trillion |
2010 | $0.86 Trillion |
Average Student Debt Per Borrower
- Average Federal Student Loan Debt Per Borrower: $37,088
- Median Federal Student Loan Debt Per Borrower: $19,281
- Average Parent Borrower Debt (Parent PLUS Loan): $30,500
Related Reports: Average Student Loan Debt By Year (Graduating Class)
Demographic Breakdown
Here are some key demographic information about student loans:
Student Loans By Age Group
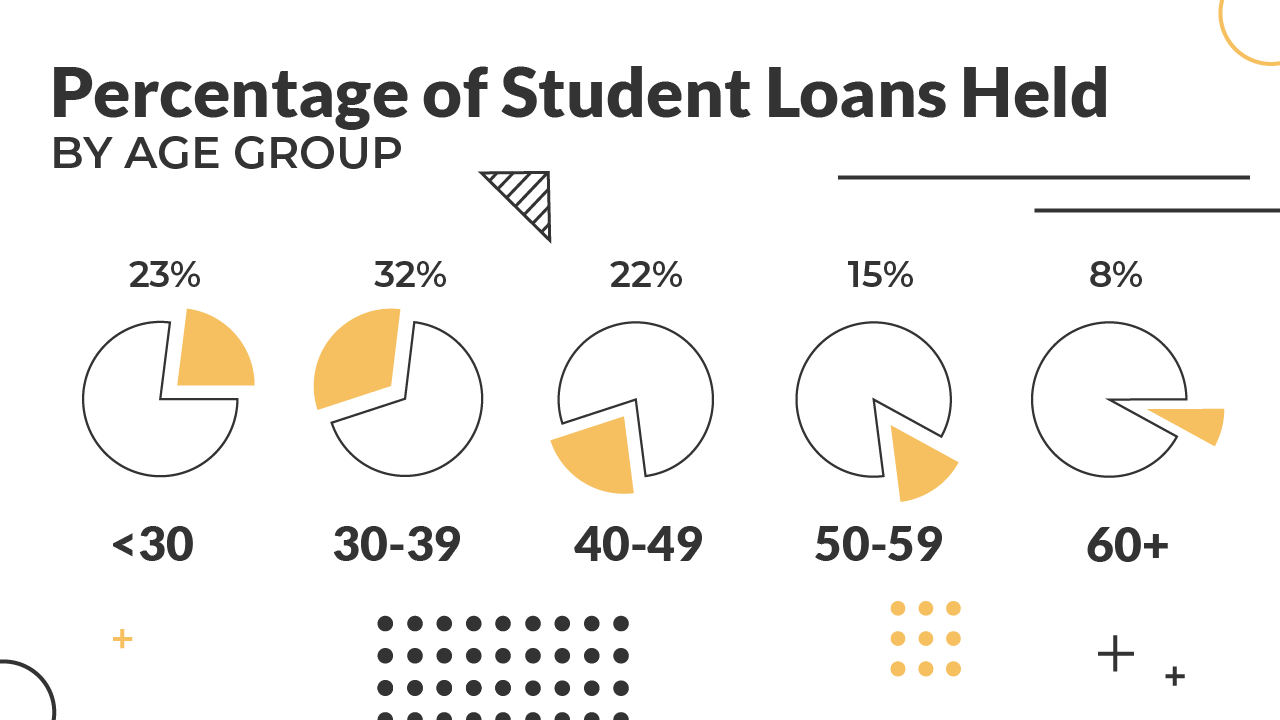
Of the $1.7 trillion in student loans, here is how much is owed by each age group:
- Under 30: 23%
- 30 - 39 Years: 32%
- 40 - 49 Years: 22%
- 50 - 59 Years: 15%
- 60+: 8%
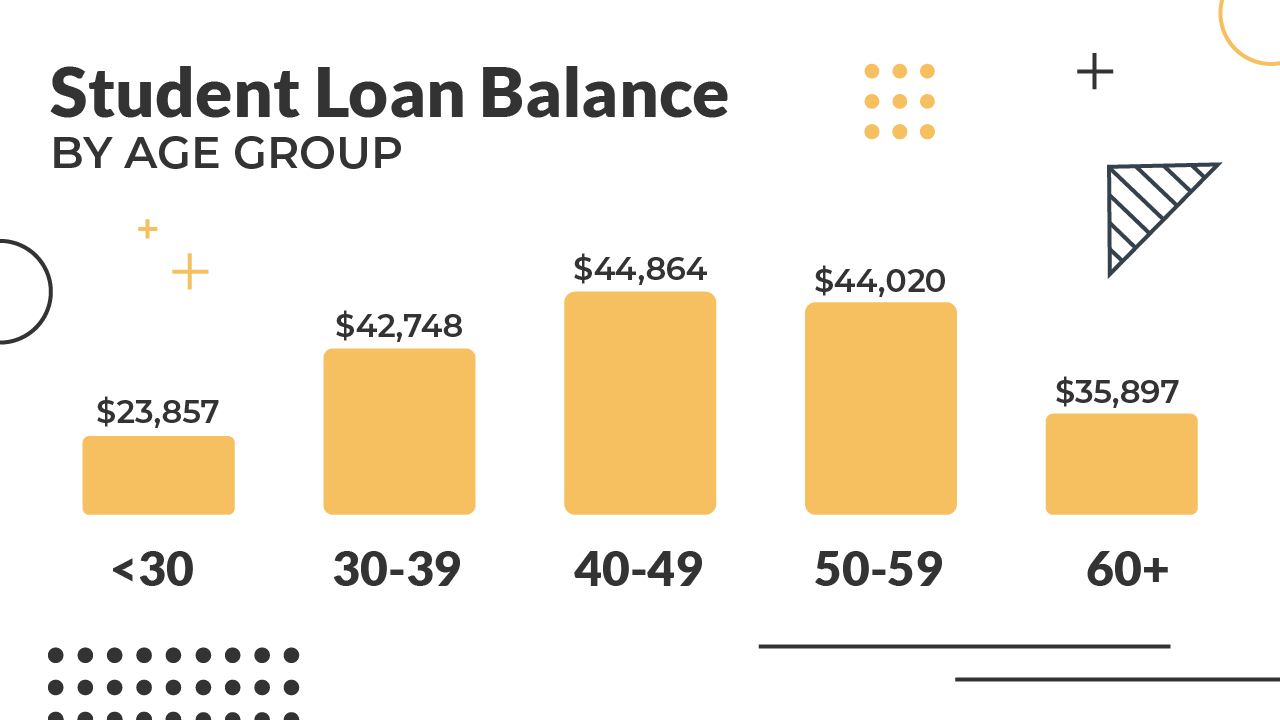
According to the Federal Reserve, here is the average balance owed in each age group:
- Under 30: $23,857
- 30 - 39 Years: $42,748
- 40 - 49 Years: $44,864
- 50 - 59 Years: $44,020
- 60+: $35,897
Student Loans By Gender
Here are key student loan statistics by gender:
- 66% of all student loan debt is held by women
- For associates degrees, 28.6% of males and 42.6% of females received student loans.
- For bachelor's degrees, 52.2% of males and 61.4% of females received student loans.
- Borrowers who identify as LGBTQ+ owe an average of $6,000 more in student loan debt.
Student Loans By Race And Ethnicity
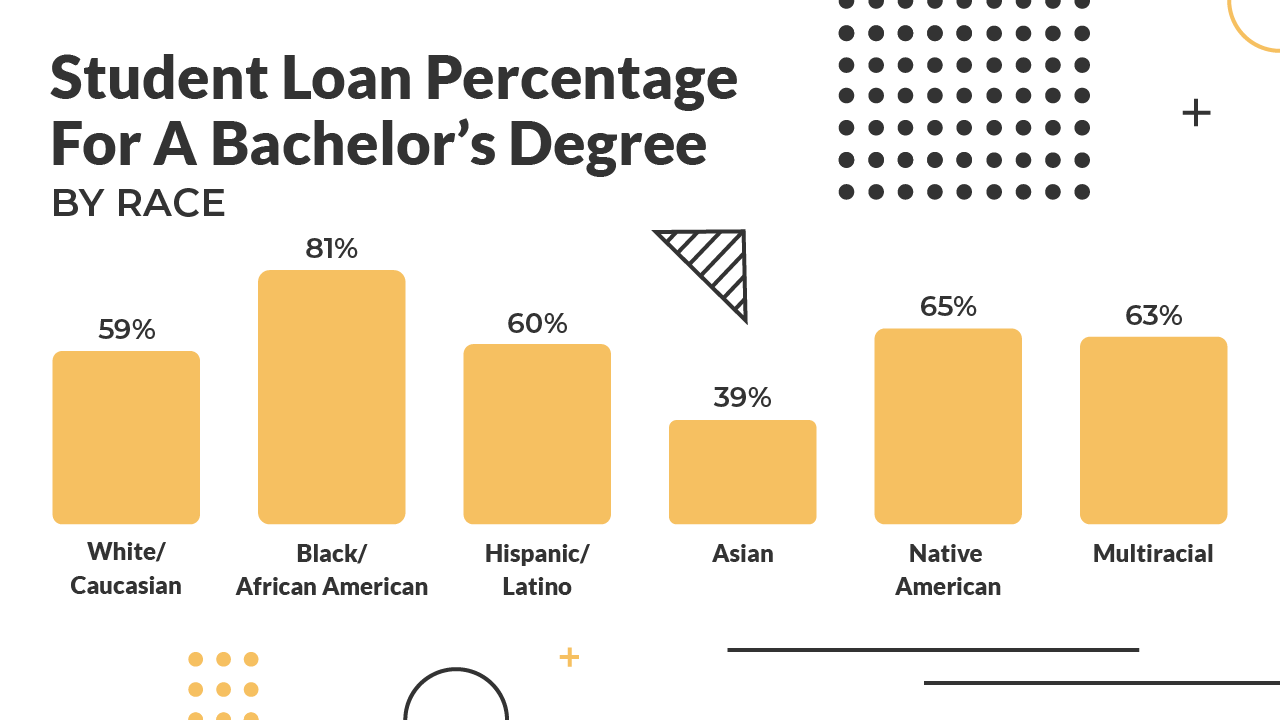
Here is some data about student loans by race and ethnicity. Here is the percentage of each group that borrows student loans for a bachelor's degree:
- White/Caucasian: 59%
- Black/African American: 81%
- Hispanic/Latino: 60%
- Asian: 39%
- Native American: 65%
- Multiracial: 63%
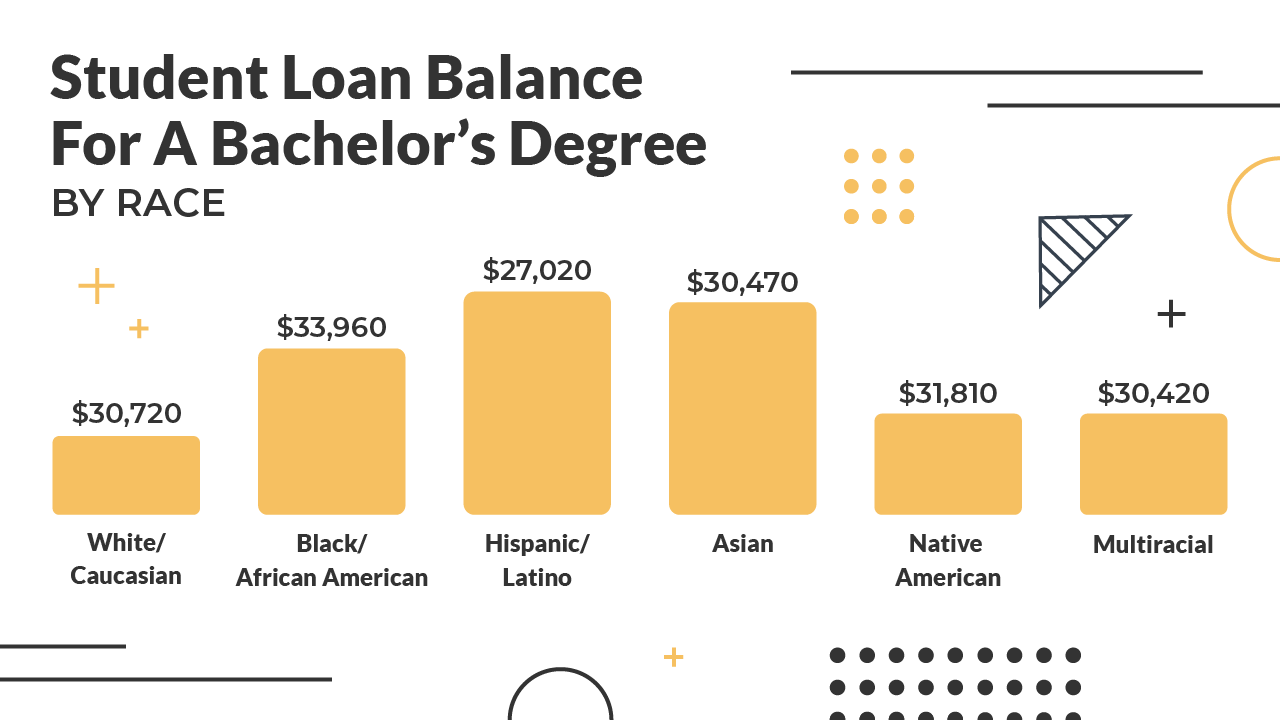
Here is the average amount of student loans borrowed for a bachelor's degree by race and ethnicity:
- White/Caucasian: $30,720
- Black/African American: $33,960
- Hispanic/Latino: $27,020
- Asian: $30,470
- Native American: $31,810
- Multiracial: $30,420
Student Loans By Education Level
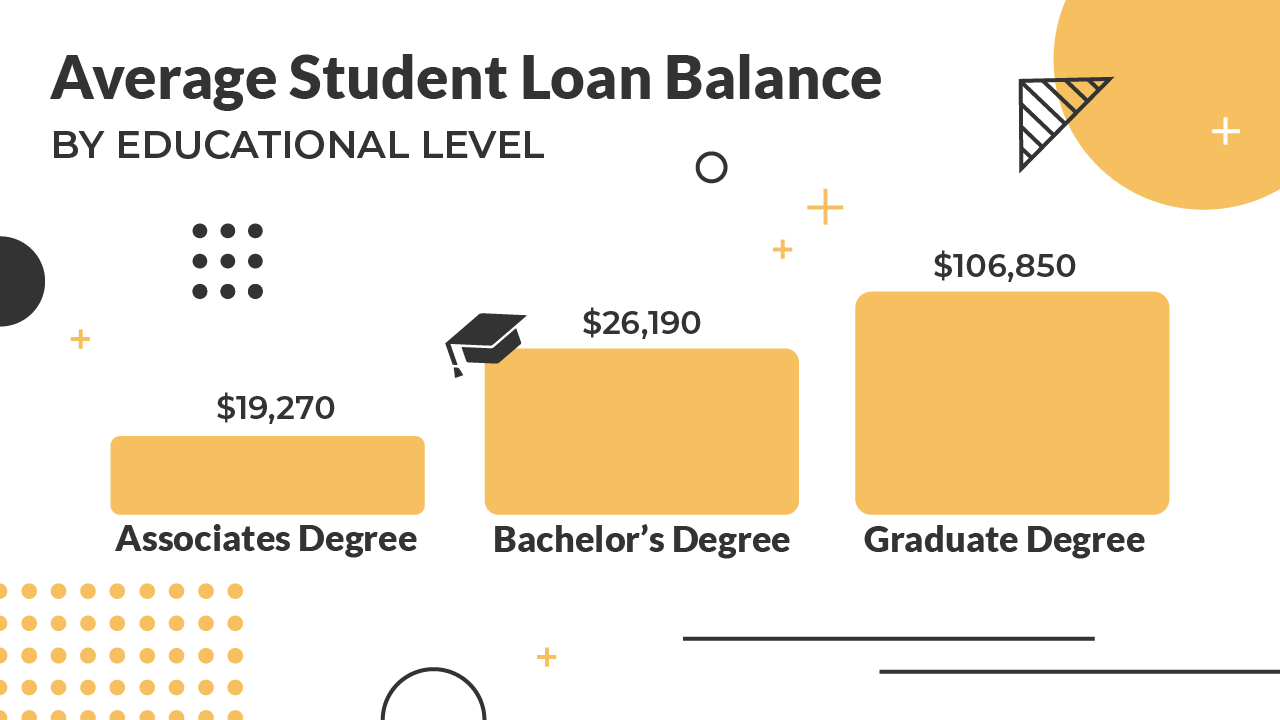
Here are some student loan facts by education level attained. Below is the average student loan balance by degree-level attained:
- Associates Degree: $19,270
- Bachelor's Degree: $26,190
- Graduate Degree: $106,850
Geographic Breakdown
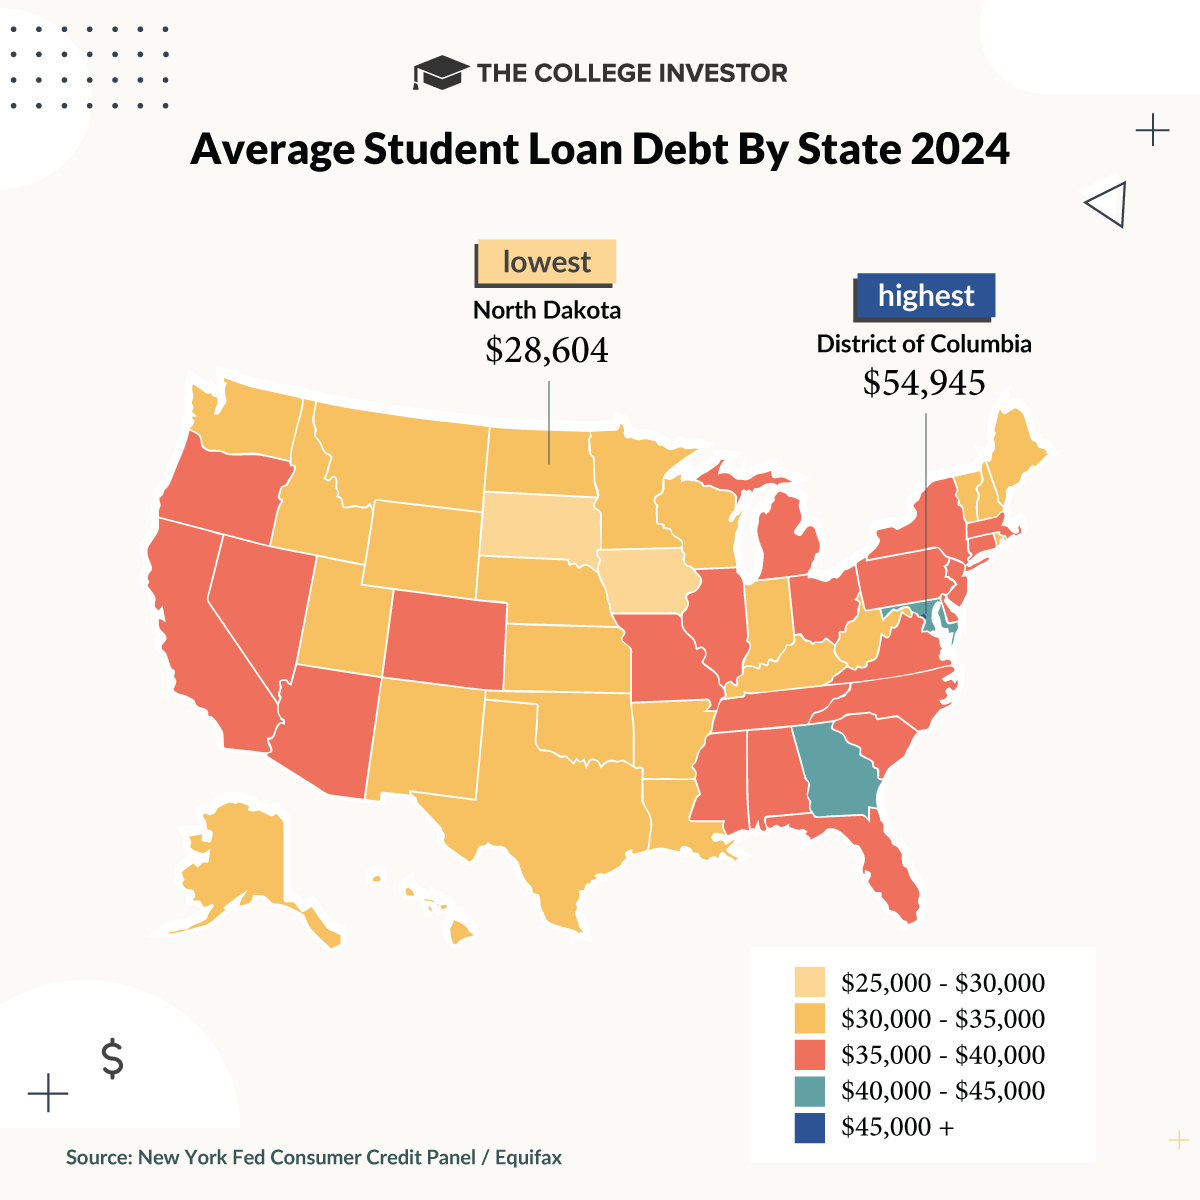
Here is the geographic breakdown of student loans:
- Most borrowers: California (3.8 million)
- Fewest borrowers: Wyoming (54,400)
- Lowest Average Balance: North Dakota ($28,604)
- Highest Average Balance: Maryland ($42,861)*
* Washington, DC has the highest balance, but they aren't a state. Maryland is the state with the highest balance.
Related Reports: Average Student Loan Debt By State
Student Loan Repayment Statistics
Here are some of the key statistics about student loan repayment.
- Average student loan monthly payment: $503*
- Median monthly payment on student loan debt: $290*
* The last data point was $393 per month, in 2016. Adjusted for inflation, that would be $503 in today's dollars. For median debt, the last data point in 2016 was $222. Adjusted for inflation, that would be $290 in today's dollars.
Types Of Repayment Plans
Here is a breakdown of the Federal student loan portfolio by repayment plan type:
- Standard 10-Year Plan: 43% of borrowers
- Extended Plan: 5% of borrowers
- Graduated Plan: 9.5% of borrowers
- Income-Contingent: 3.8% of borrowers
- Income-Based: 6.5% of borrowers
- PAYE: 4.5% of borrowers
- SAVE: 26% of borrowers
- Other: 2.6% of borrowers

Remember, the Standard 10-Year plan data is slightly skewed because it includes all new loans while borrowers are in-school deferment.
The Department of Education believes that SAVE will be the main repayment plan for most borrowers within 2 years.
Related Reports: Average Student Loan Payment
Student Loan Forgiveness Data
Here are some of the key impacts of student loan forgiveness programs. We estimate that over 50% of student loan borrowers are eligible for some type of total or partial loan forgiveness program.
- Income-Driven Loan Forgiveness: 40% of student loan borrowers are enrolled in qualifying repayment plans
- Public Service Loan Forgiveness: 3.3 million student loan borrowers eligible (7.6% of all student loan borrowers)
Public Service Loan Forgiveness
- Borrowers With Certified Employment and Student Loan Balances: 2,062,648
- Total Eligible Student Loan Debt: $182 Billion
- Total PSLF Loan Forgiveness Processed Through 2023: 670,264 Borrowers
- Average PSLF Balance Forgiven: $69,776
Learn more about Public Service Loan Forgiveness.
Teacher Loan Forgiveness
- Borrowers With Loans Forgiven In 2023: 12,400
- Total Amount Forgiven: $127.2 Million
Learn more about Teacher Loan Forgiveness.
Borrower Defense To Repayment
- Total Applications Received: 779,785
- Total Approved Applications: 190,869
Learn more about Borrower Defense To Repayment.
47 states, Washington DC, and Puerto Rico all have their own state-based student loan forgiveness programs.
Related Reports: For-Profit College Student Loan Forgiveness List, Complete List Of Student Loan Forgiveness Programs
Student Loan Default Statistics
Here are some of the main student loan default statistics.
- 7% of student loans are in default at any given time.
- Default rates have been dropping steadily since 2010.
- 15.6% of student borrowers who attended a private, for-profit college defaulted within the three years of graduation.
Due to the payment pause, the Federal student aid default rate was 0% from 2021 through 2023.
Learn about Student Loan Default.
